

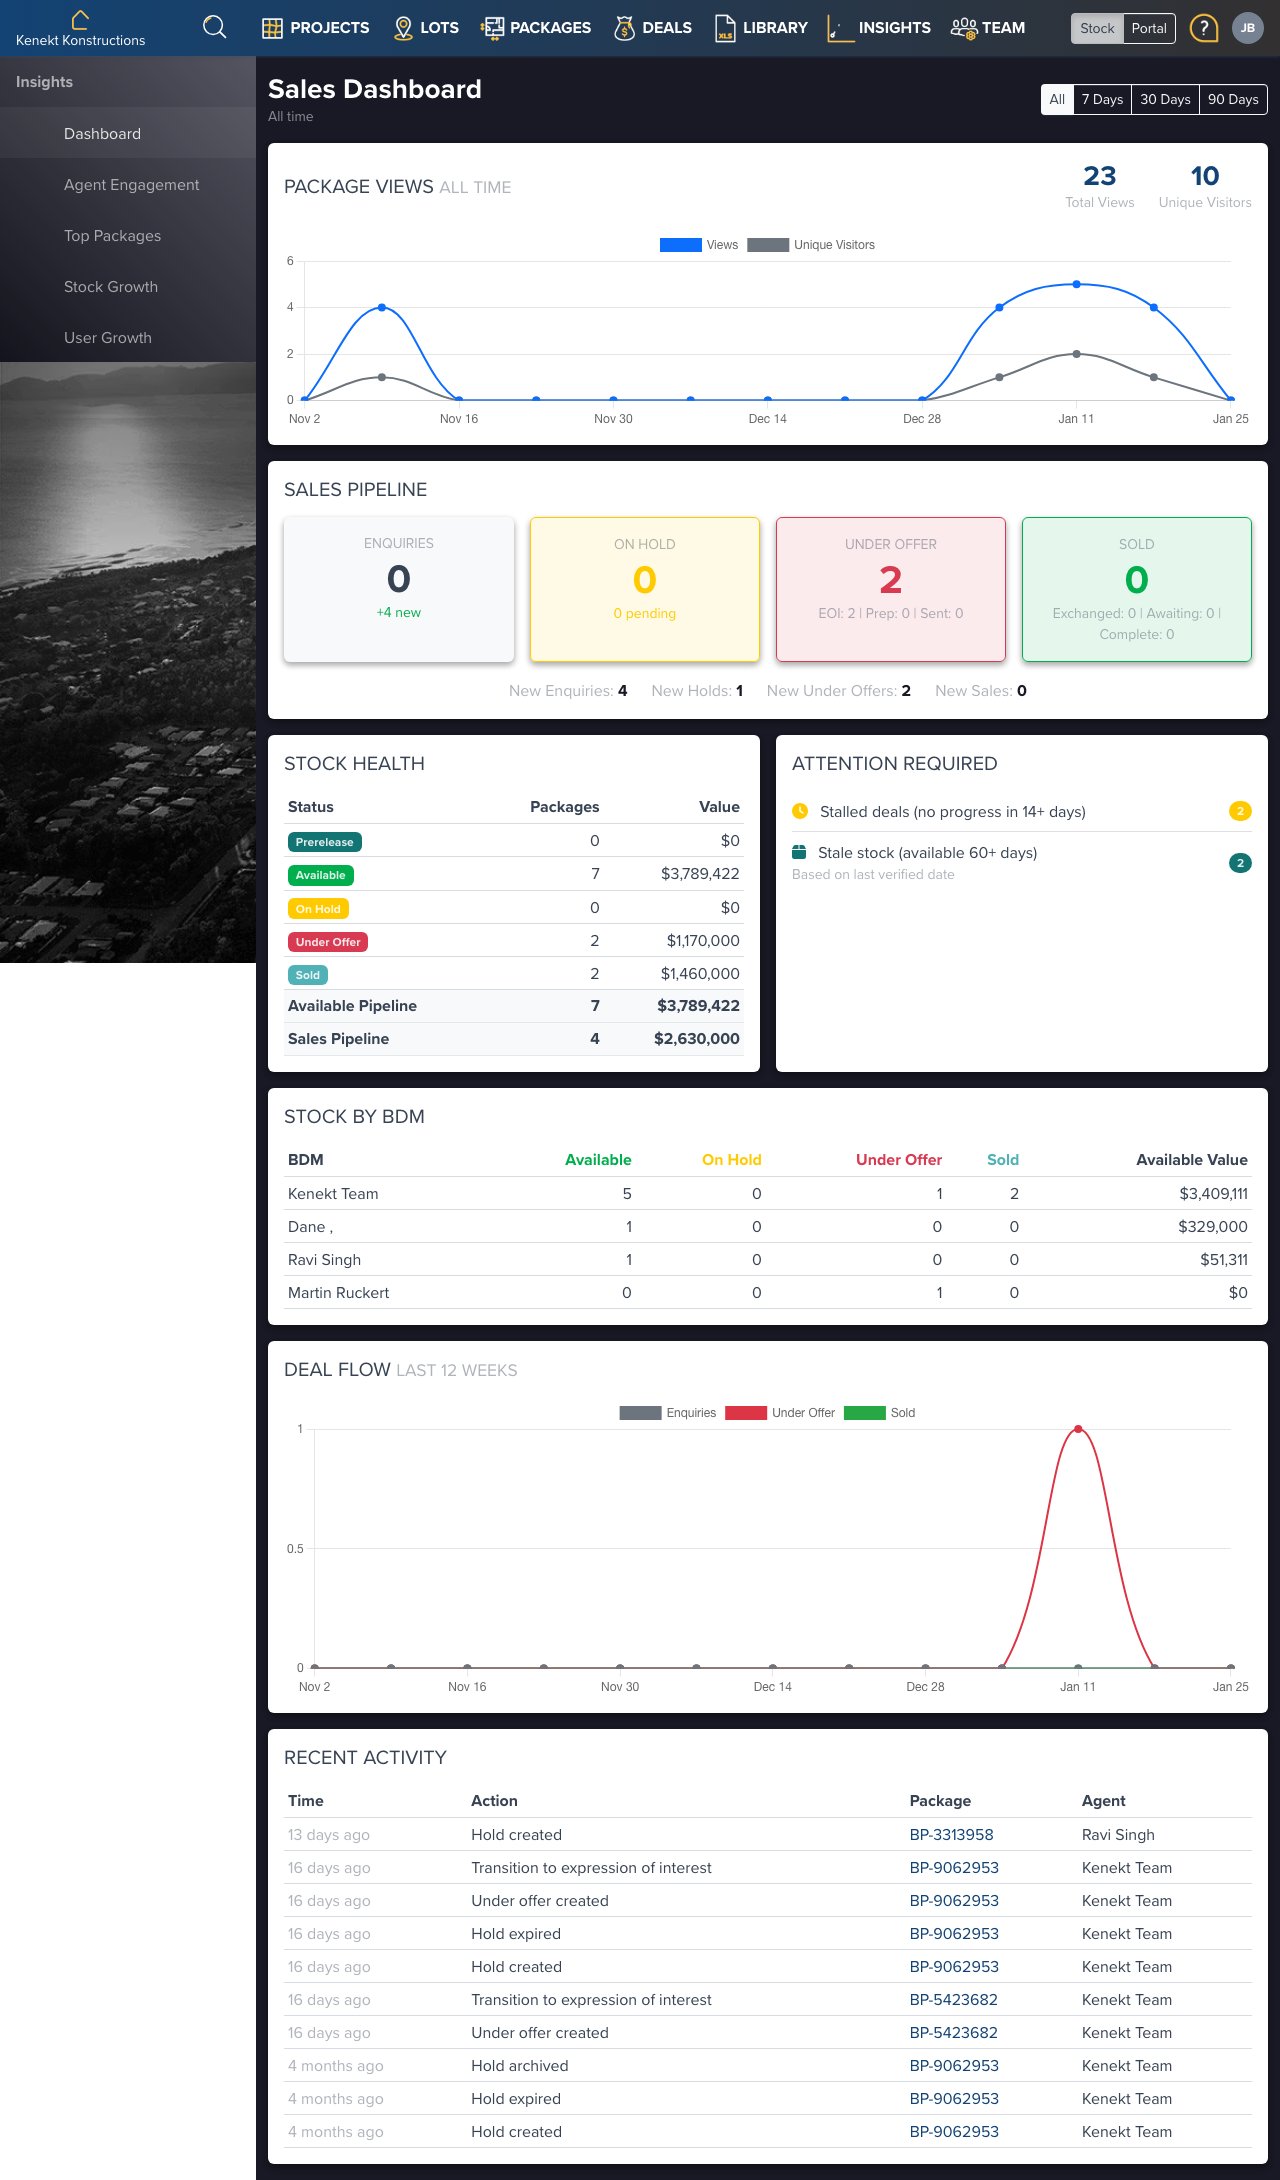
Dashboard Sections
Package Views
Track how many times agents are viewing your packages over time. Filter by date range (7 days, 30 days, 90 days).Sales Pipeline
See your deals at each stage:- Enquiry: New interest
- Hold: Reserved packages
- Under Offer: Contracts in progress
- Exchanged: Completed sales
Stock Health
Monitor your inventory:- Packages by status (Available, Hold, Under Offer, Sold)
- Total available value
- Pipeline value
Attention Required
Alerts for items needing action:- Stalled deals (no progress in 14+ days)
- Low stock warnings
Stock by BDM
See package distribution across your team with available counts and values per BDM.Deal Flow
Visual timeline of deal activity over recent weeks.Recent Activity
Live feed of actions: holds created, offers made, status changes.Navigation
Use the sidebar to access other Insights views:- Agent Engagement: Portal usage stats
- Top Packages: Most viewed packages
- Stock Growth: Inventory trends
- User Logins: Team activity